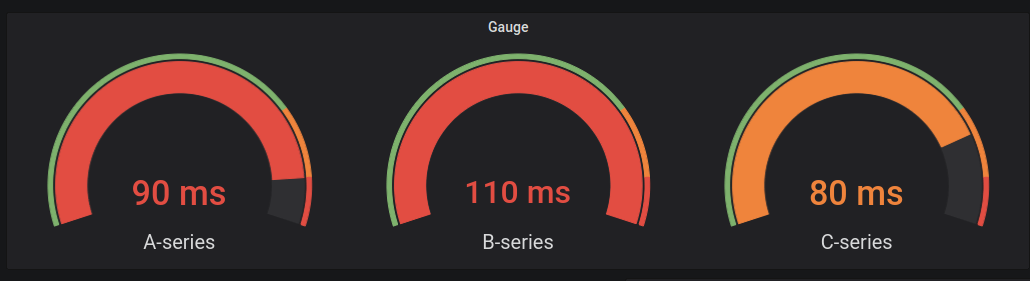
Gauge panel
Gauge is a single value panel that can repeat a gauge for every series, column or row.
Gauge visualizations allow you to apply:
Use the following options to refine your visualization:
- Show - Choose how DranSCADA displays your data.
- Calculate - Show a calculated Value based on all rows. For a list of available calculations, refer to List of calculations.
- All values - Show a separate stat for every row. If you select this option, then you can also select a Limit, or the maximum number of rows to display.
- Orientation - Choose a stacking direction.
- Auto - DranSCADA selects what it thinks is the best orientation.
- Horizontal - Bars stretch horizontally, left to right.
- Vertical - Bars stretch vertically, top to bottom.
- Show threshold labels - Controls if threshold values are shown.
- Show threshold markers - Controls if a threshold band is shown outside the inner gauge value band.