Transformation types and options
DranSCADA comes with the following transformations:
- Reduce
- Filter by name
- Filter data by query
- Organize fields
- Outer join
- Series to rows
- Add field from calculation
- Labels to fields
- Group by
- Merge
Keep reading for detailed descriptions of each type of transformation and the options available for each, as well as suggestions on how to use them.
Apply a Reduce transformation when you want to simplify your results down to one value. Reduce removes the time component. If visualized as a table, it reduces a column down to one row (value).
In the Calculations field, enter one or more calculation types. Click to see a list of calculation choices. For information about available calculations, refer to the Calculation list.
Once you select at least one calculation, DranSCADA reduces the results down to one value using the calculation you select. If you select more than one calculation, then more than one value is displayed.
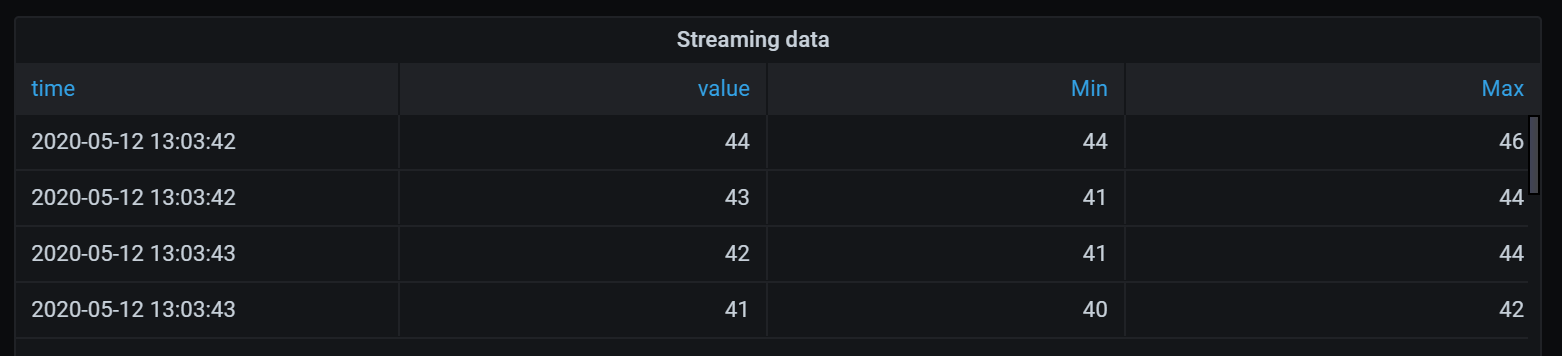
Here’s an example of a table with time series data. Before I apply the transformation, you can see all the data organized by time.
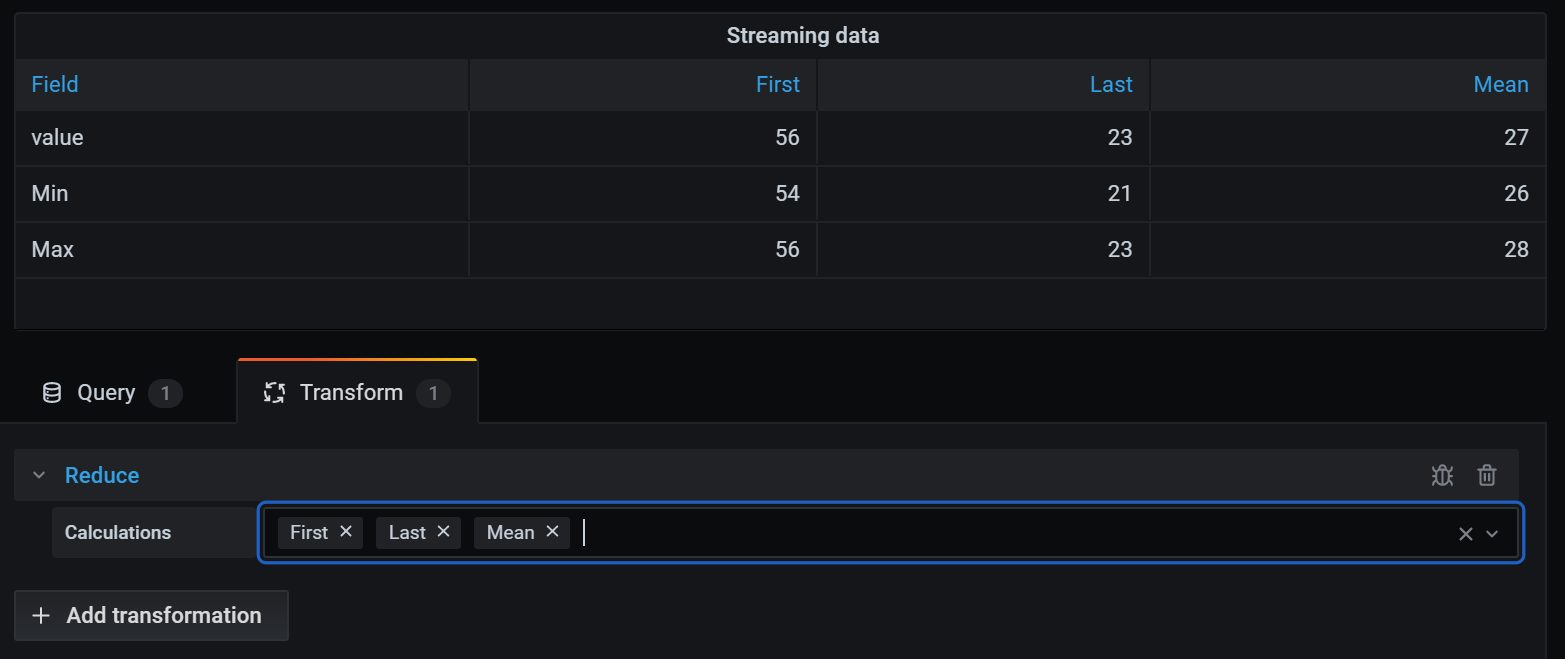
After I apply the transformation, there is no time value and each column has been reduced to one row showing the results of the calculations that I chose.
Note: This transformation is only available in DranSCADA 7.1+.
Use this transformation to combine the result from multiple queries into one single result. This is helpful when using the table panel visualization. Values that can be merged are combined into the same row. Values are mergeable if the shared fields contain the same data. For information, refer to Table panel.
In the example below, we have two queries returning table data. It is visualized as two separate tables before applying the transformation.
Query A:
| Time | Job | Uptime |
|---|---|---|
| 2020-07-07 11:34:20 | node | 25260122 |
| 2020-07-07 11:24:20 | postgre | 123001233 |
Query B:
| Time | Job | Errors |
|---|---|---|
| 2020-07-07 11:34:20 | node | 15 |
| 2020-07-07 11:24:20 | postgre | 5 |
Here is the result after applying the Merge transformation.
| Time | Job | Errors | Uptime |
|---|---|---|---|
| 2020-07-07 11:34:20 | node | 15 | 25260122 |
| 2020-07-07 11:24:20 | postgre | 5 | 123001233 |
Use this transformation to remove portions of the query results.
DranSCADA displays the Identifier field, followed by the fields returned by your query.
You can apply filters in one of two ways:
- Enter a regex expression.
- Click a field to toggle filtering on that field. Filtered fields are displayed with dark gray text, unfiltered fields have white text.
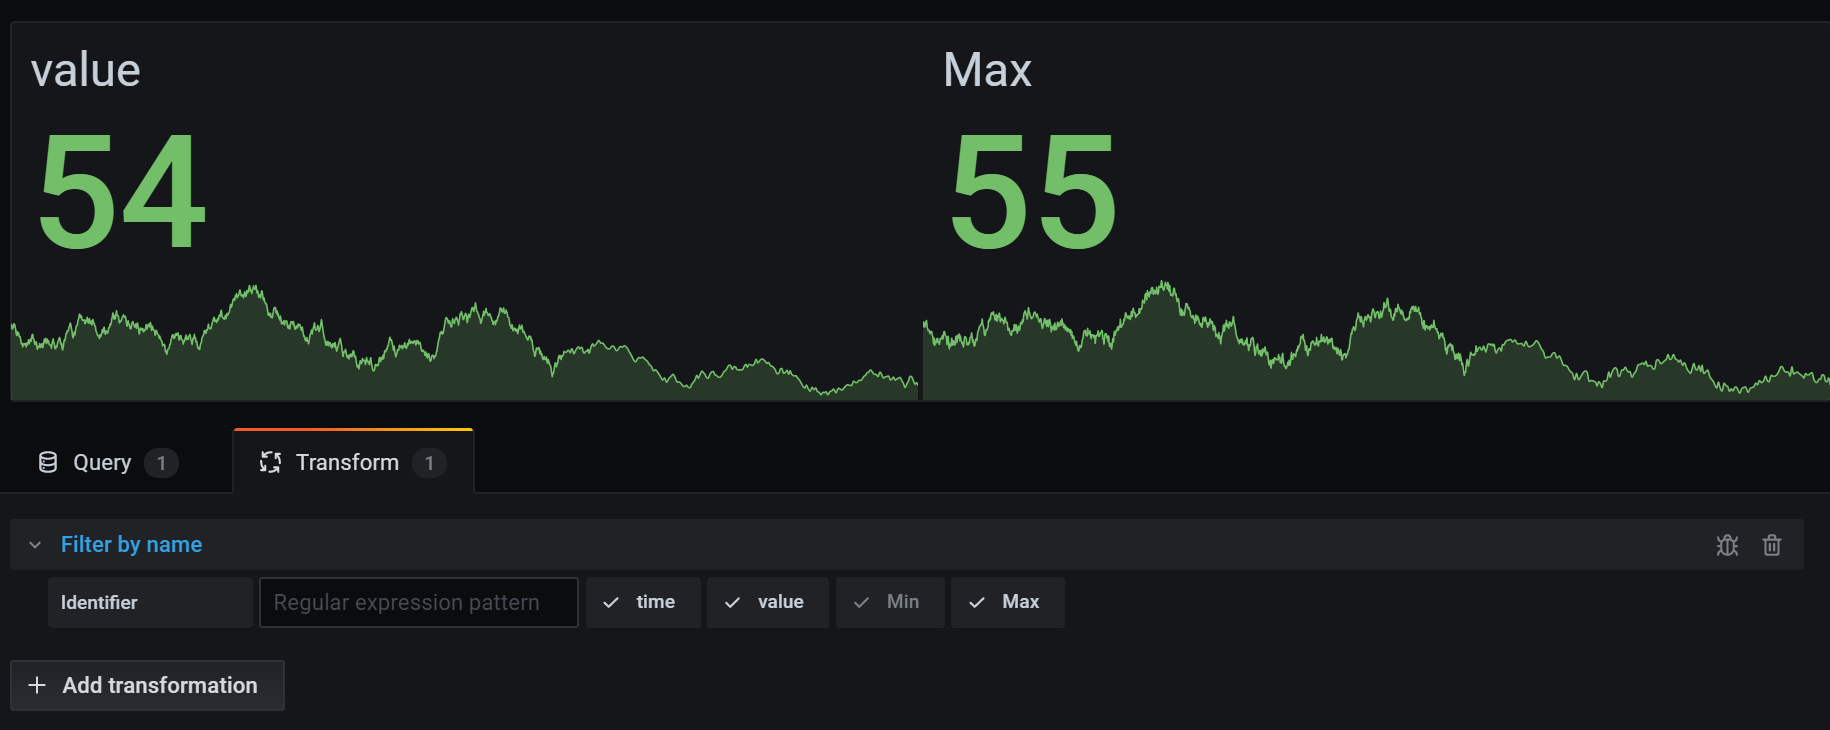
In the example below, I removed the Min field from the results.
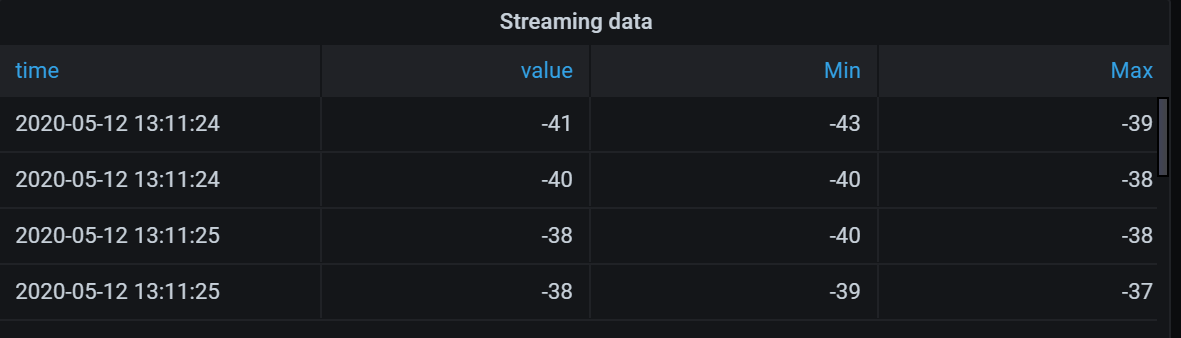
Here is the original query table. (This is streaming data, so numbers change over time and between screenshots.)
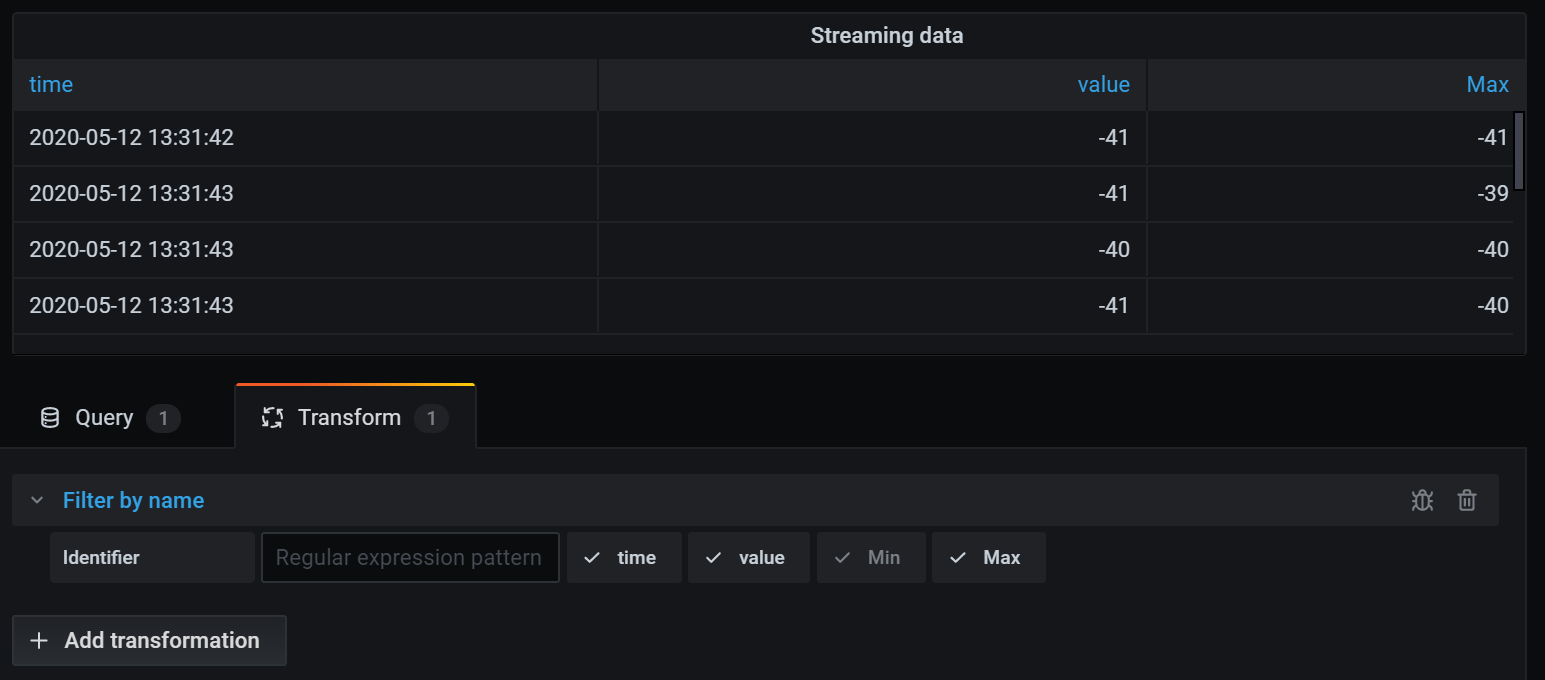
Here is the table after I applied the transformation to remove the Min field.
Here is the same query using a Stat visualization.
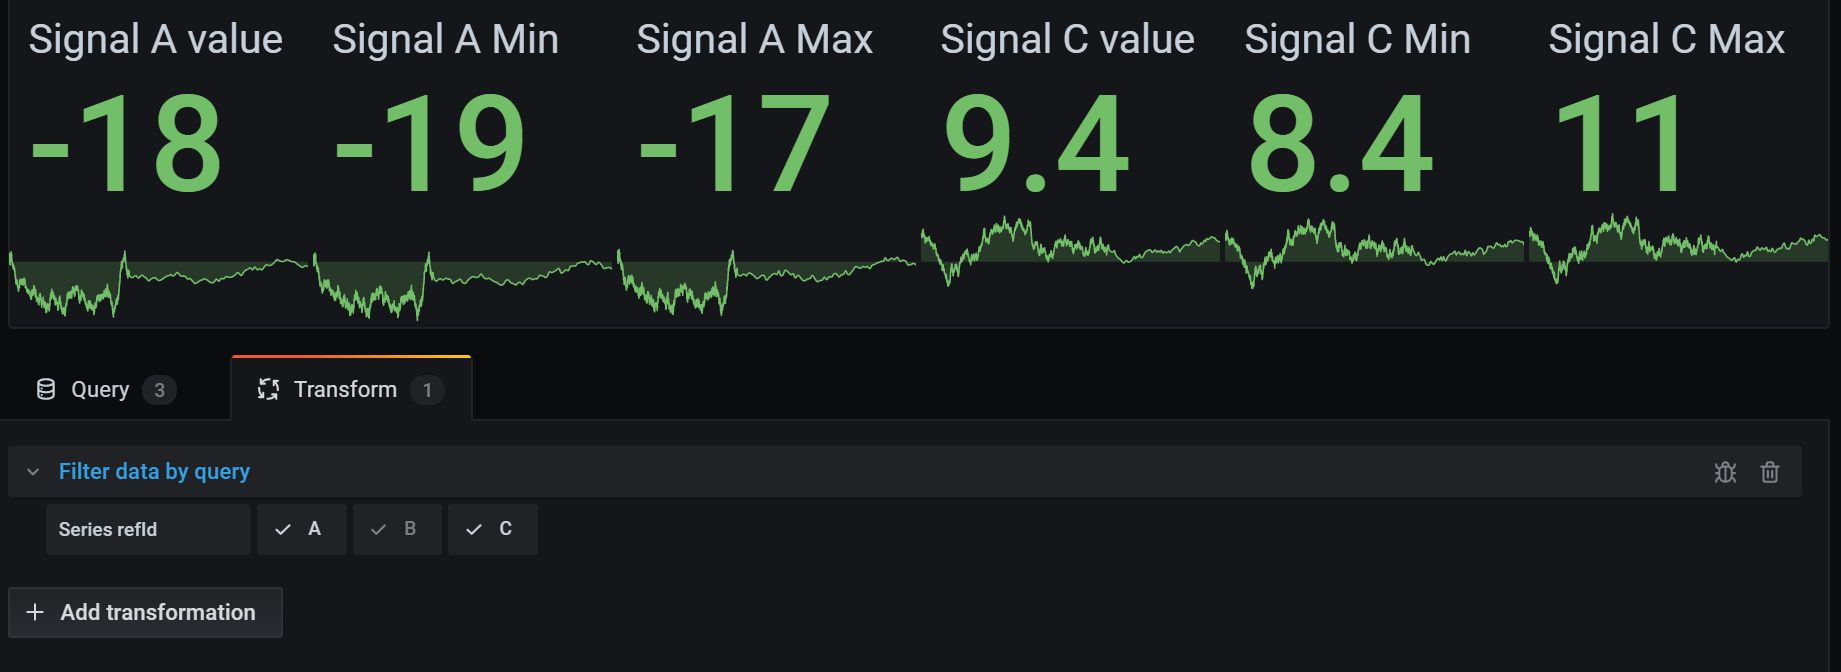
Use this transformation in panels that have multiple queries, if you want to hide one or more of the queries.
DranSCADA displays the query identification letters in dark gray text. Click a query identifier to toggle filtering. If the query letter is white, then the results are displayed. If the query letter is dark, then the results are hidden.
In the example below, the panel has three queries (A, B, C). I removed the B query from the visualization.
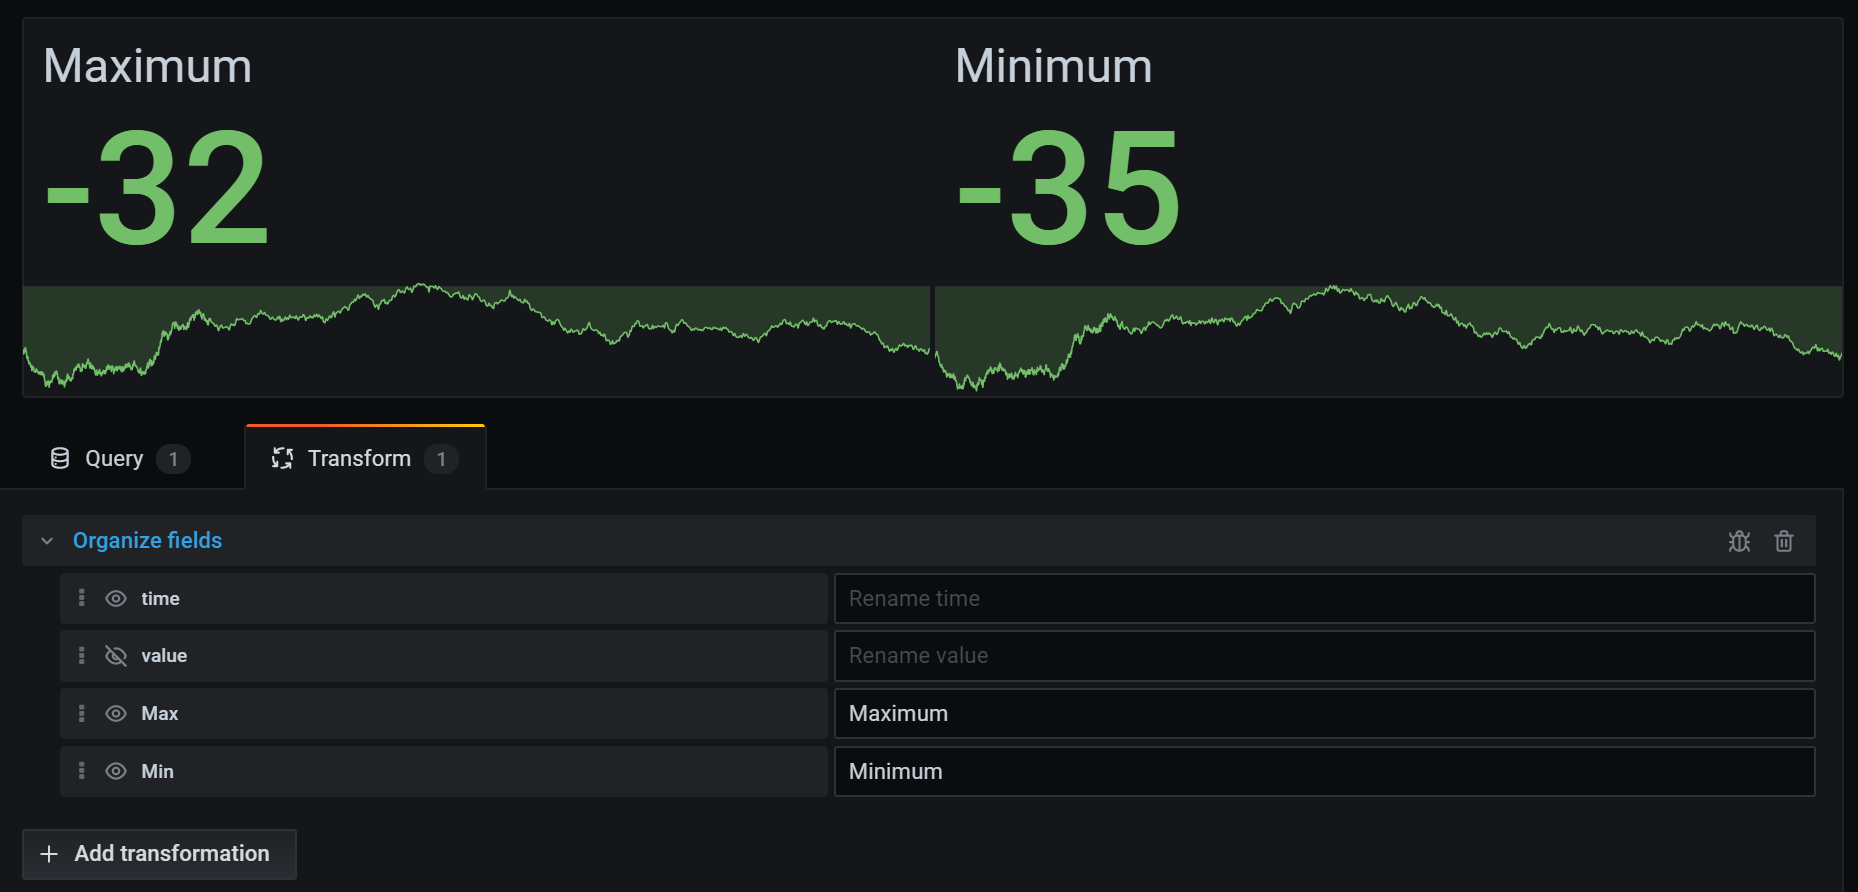
Use this transformation to rename, reorder, or hide fields returned by the query.
Note: This transformation only works in panels with a single query. If your panel has multiple queries, then you must either apply an Outer join transformation or remove the extra queries.
DranSCADA displays a list of fields returned by the query. You can:
- Change field order by hovering your cursor over a field. The cursor turns into a hand and then you can drag the field to its new place.
- Hide or show a field by clicking the eye icon next to the field name.
- Rename fields by typing a new name in the Rename
box.
In the example below, I hid the value field and renamed Max and Min.
Use this transformation to join multiple time series from a result set by field.
This transformation is especially useful if you want to combine queries so that you can calculate results from the fields.
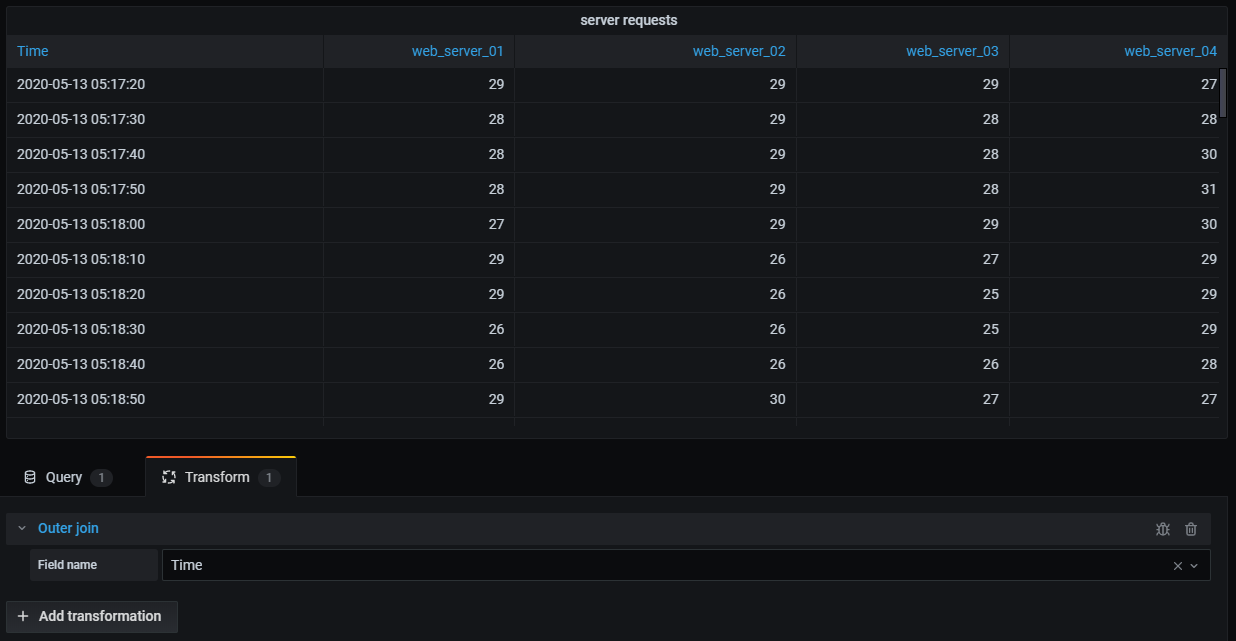
In the example below, I have a template query displaying time series data from multiple servers in a table visualization. I can only view the results of one query at a time.
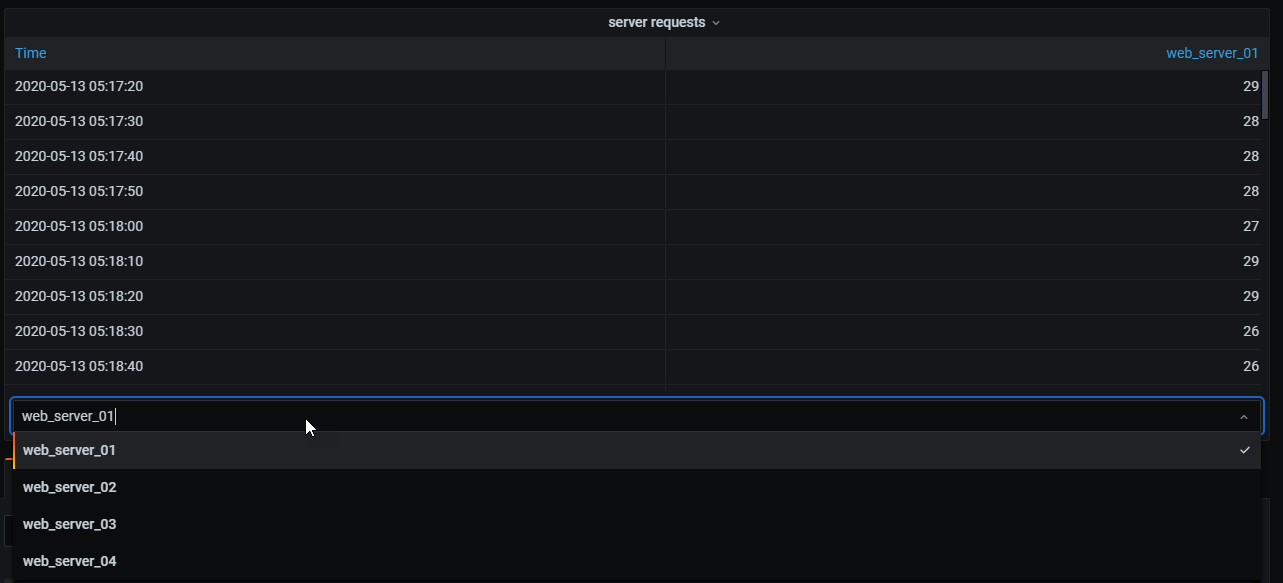
I applied a transformation to join the query results using the time field. Now I can run calculations, combine, and organize the results in this new table.
Use this transformation to add a new field calculated from two other fields. Each transformation allows you to add one new field.
- Mode - Select a mode:
- Reduce row - Apply selected calculation on each row of selected fields independently.
- Binary option - Apply basic math operation(sum, multiply, etc) on values in a single row from two selected fields.
- Field name - Select the names of fields you want to use in the calculation for the new field.
- Calculation - Select a calculation to use when DranSCADA creates the new field. Click in the field to see a list of calculation choices. For information about available calculations, refer to the Calculation list.
- Alias - (Optional) Enter the name of your new field. If you leave this blank, then the field will be named to match the calculation.
- Replace all fields - (Optional) Select this option if you want to hide all other fields and display only your calculated field in the visualization.
In the example below, I added two fields together and named them Sum.

Note: In order to apply this transformation, your query needs to return labeled fields.
When you select this transformation, DranSCADA automatically transforms all labeled data into fields.
Example: Given a query result of two time series
1: labels Server=Server A, Datacenter=EU 2: labels Server=Server B, Datacenter=EU
This would result in a table like this:
| Time | Server | Datacenter | Value |
|---|---|---|---|
| 2020-07-07 11:34:20 | Server A | EU | 1 |
| 2020-07-07 11:34:20 | Server B | EU | 2 |
Value field name
If you selected Server as the Value field name, then you would get one field for every value of the Server label.
| Time | Datacenter | Server A | Server B |
|---|---|---|---|
| 2020-07-07 11:34:20 | EU | 1 | 2 |
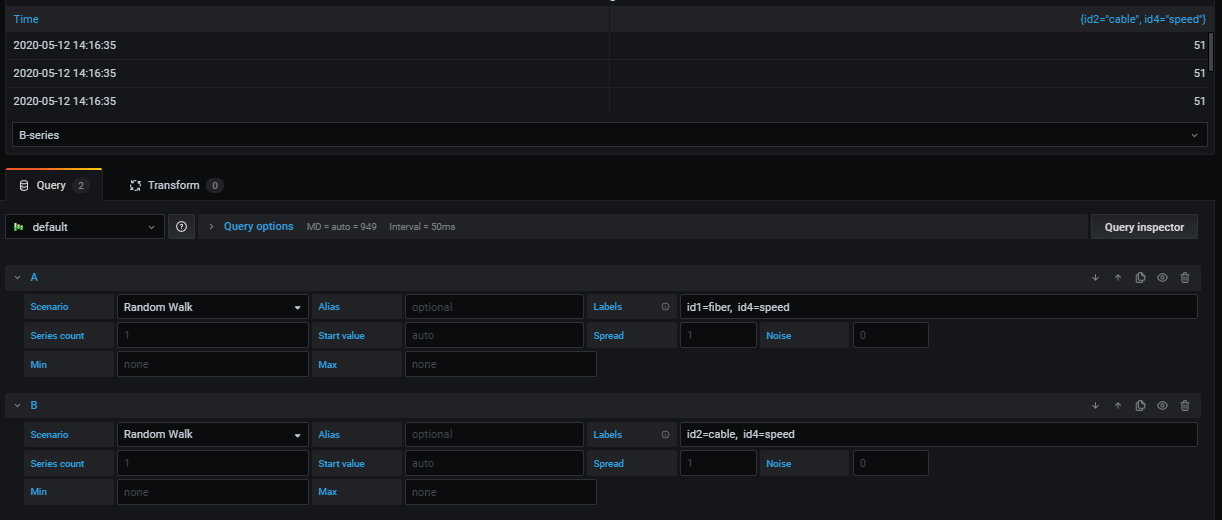
For this example, I manually defined labels in the Random Walk visualization of TestData DB.
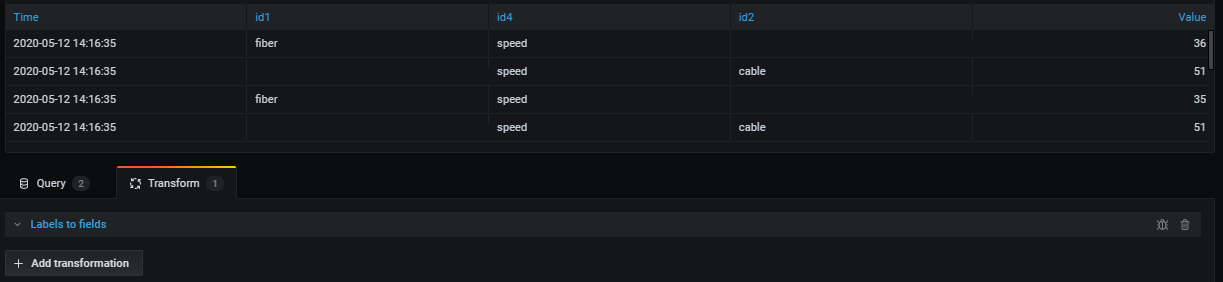
After I apply the transformation, my labels appear in the table as fields.
Note: This transformation is only available in DranSCADA 7.2+.
This transformation groups the data by a specified field (column) value and processes calculations on each group. Click to see a list of calculation choices. For information about available calculations, refer to the List of calculations.
Here’s an example of original data.
| Time | Server ID | CPU Temperature | Server Status |
|---|---|---|---|
| 2020-07-07 11:34:20 | server 1 | 80 | Shutdown |
| 2020-07-07 11:34:20 | server 3 | 62 | OK |
| 2020-07-07 10:32:20 | server 2 | 90 | Overload |
| 2020-07-07 10:31:22 | server 3 | 55 | OK |
| 2020-07-07 09:30:57 | server 3 | 62 | Rebooting |
| 2020-07-07 09:30:05 | server 2 | 88 | OK |
| 2020-07-07 09:28:06 | server 1 | 80 | OK |
| 2020-07-07 09:25:05 | server 2 | 88 | OK |
| 2020-07-07 09:23:07 | server 1 | 86 | OK |
This transformation goes in two steps. First you specify one or multiple fields to group the data by. This will group all the same values of those fields together, as if you sorted them. For instance if we group by the Server ID field, then it would group the data this way:
| Time | Server ID | CPU Temperature | Server Status |
|---|---|---|---|
| 2020-07-07 11:34:20 | server 1 | 80 | Shutdown |
| 2020-07-07 09:28:06 | server 1 | 80 | OK |
| 2020-07-07 09:23:07 | server 1 | 86 | OK |
| 2020-07-07 10:32:20 | server 2 | 90 | Overload |
| 2020-07-07 09:30:05 | server 2 | 88 | OK |
| 2020-07-07 09:25:05 | server 2 | 88 | OK |
| 2020-07-07 11:34:20 | server 3 | 62 | OK |
| 2020-07-07 10:31:22 | server 3 | 55 | OK |
| 2020-07-07 09:30:57 | server 3 | 62 | Rebooting |
All rows with the same value of Server ID are grouped together.
After choosing which field you want to group your data by, you can add various calculations on the other fields, and apply the calculation to each group of rows. For instance, we could want to calculate the average CPU temperature for each of those servers. So we can add the mean calculation applied on the CPU Temperature field to get the following:
| Server ID | CPU Temperature (mean) |
|---|---|
| server 1 | 82 |
| server 2 | 88.6 |
| server 3 | 59.6 |
And we can add more than one calculation. For instance:
- For field Time, we can calculate the Last value, to know when the last data point was received for each server
- For field Server Status, we can calculate the Last value to know what is the last state value for each server
- For field Temperature, we can also calculate the Last value to know what is the latest monitored temperature for each server
We would then get :
| Server ID | CPU Temperature (mean) | CPU Temperature (last) | Time (last) | Server Status (last) |
|---|---|---|---|---|
| server 1 | 82 | 80 | 2020-07-07 11:34:20 | Shutdown |
| server 2 | 88.6 | 90 | 2020-07-07 10:32:20 | Overload |
| server 3 | 59.6 | 62 | 2020-07-07 11:34:20 | OK |
This transformation allows you to extract some key information out of your time series and display them in a convenient way.
Note: This transformation is only available in DranSCADA 7.1+.
Use this transformation to combine the result from multiple time series data queries into one single result. This is helpful when using the table panel visualization.
The result from this transformation will contain three columns: Time, Metric, and Value. The Metric column is added so you easily can see from which query the metric originates from. Customize this value by defining Label on the source query.
In the example below, we have two queries returning time series data. It is visualized as two separate tables before applying the transformation.
Query A:
| Time | Temperature |
|---|---|
| 2020-07-07 11:34:20 | 25 |
| 2020-07-07 10:31:22 | 22 |
| 2020-07-07 09:30:05 | 19 |
Query B:
| Time | Humidity |
|---|---|
| 2020-07-07 11:34:20 | 24 |
| 2020-07-07 10:32:20 | 29 |
| 2020-07-07 09:30:57 | 33 |
Here is the result after applying the Series to rows transformation.
| Time | Metric | Value |
|---|---|---|
| 2020-07-07 11:34:20 | Temperature | 25 |
| 2020-07-07 11:34:20 | Humidity | 22 |
| 2020-07-07 10:32:20 | Humidity | 29 |
| 2020-07-07 10:31:22 | Temperature | 22 |
| 2020-07-07 09:30:57 | Humidity | 33 |
| 2020-07-07 09:30:05 | Temperature | 19 |