Standard field options
This section explains all available field options. They are listed in alphabetical order.
You can apply standard field options to most built-in DranSCADA panels.
Most field options will not affect the visualization until you click outside of the field option box you are editing or press Enter.
For more information about applying these options, refer to:
Number of decimals to render value with. Leave empty for DranSCADA to use the number of decimals provided by the data source.
To change this setting, type a number in the field and then click outside the field or press Enter.
Lets you control the URL to which a value or visualization link.
For more information and instructions, refer to Data links.
Lets you set the display title of all fields. You can use variables in the field title.
When multiple stats, fields, or series are shown, this field controls the title in each stat. You can use expressions like ${__field.name} to use only the series name or the field name in title.
Given a field with a name of Temp, and labels of {“Loc”=“PBI”, “Sensor”=“3”}
| Expression syntax | Example | Renders to | Explanation |
|---|---|---|---|
${__field.displayName} |
Same as syntax | Temp {Loc="PBI", Sensor="3"} |
Displays the field name, and labels in {} if they are present. If there is only one label key in the response, then for the label portion, DranSCADA displays the value of the label without the enclosing braces. |
${__field.name} |
Same as syntax | Temp |
Displays the name of the field (without labels). |
${__field.labels} |
Same as syntax | Loc="PBI", Sensor="3" |
Displays the labels without the name. |
${__field.labels.X} |
${__field.labels.Loc} |
PBI |
Displays the value of the specified label key. |
${__field.labels.__values} |
Same as Syntax | PBI, 3 |
Displays the values of the labels separated by a comma (without label keys). |
If the value is an empty string after rendering the expression for a particular field, then the default display method is used.
Lets you set the maximum value used in percentage threshold calculations. Leave blank for auto calculation based on all series and fields
Lets you set the minimum value used in percentage threshold calculations. Leave blank for auto calculation based on all series and fields
Enter what DranSCADA should display if the field value is empty or null.
Lets you choose what unit a field should use. Click in the Unit field, then drill down until you find the unit you want. The unit you select is applied to all fields except time.
You can use the unit dropdown to also specify custom units, custom prefix or suffix and date time formats.
To select a custom unit enter the unit and select the last Custom: xxx option in the dropdown.
- If y u want a space -> If you want a space
suffix:<suffix>for custom unit that should go after value.time:<format>For custom date time formats type for exampletime:YYYY-MM-DD. See formats for the format syntax and options.si:<base scale><unit characters>for custom SI units. For example:si: mF. This one is a bit more advanced as you can specify both a unit and the source data scale. So if your source data is represented as milli (thousands of) something prefix the unit with that SI scale character.count:<unit>for a custom count unit.currency:<unit>for custom a currency unit.
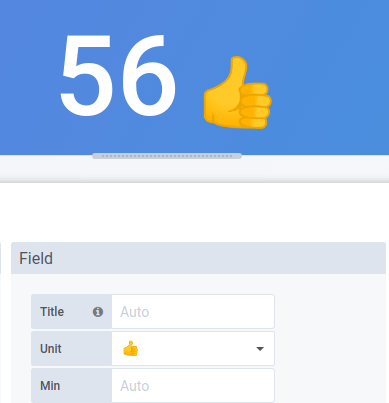
You can also paste a native emoji in the unit picker and pick it as a custom unit:
DranSCADA can sometime be too aggressive in parsing strings and displaying them as numbers. To make DranSCADA show the original string create a field override and add a unit property with the string unit.
Note: Only available in DranSCADA 7.3+.
The field color option defines how DranSCADA colors series or fields. There are multiple modes here that work very differently, and their utility depends largely on what visualization you currently have selected.
Continuous color modes use the percentage of a value relative to min and max to interpolate a color.
- Single color: Set a specific color using the color picker. Mostly useful from an override rule.
- From thresholds: Color is derived from the matching threshold. Useful for gauges, stat and table visualizations.
Then there are color schemes that define color by series. Useful for graphs and pie charts for example.
In addition to deriving color from thresholds there are also continuous (gradient) color schemes. Useful for visualizations that that color individual values. For example stat panels and the table.
Thresholds allow you to change the color of a field based on the value.
For more information and instructions, refer to Thresholds.
Lets you set rules that translate a field value or range of values into explicit text. You can add more than one value mapping.
- Mapping type - Click an option.
- Value - Enter a value. If the field value is greater than or equal to the value, then the Text is displayed.
- From and To - Enter a range. If the field value is between or equal to the values in the range, then the Text is displayed.
- Text - Text that is displayed if the conditions are met in a field. This field accepts variables.